
Cricket's Most Volatile — and Most Bettable — Format
T20 compresses cricket into 120 balls per side and three hours of chaos: one batter's burst or one bowler's bad over flips matches routinely, upsets are the norm, and the markets move violently. That volatility is the format's gift to bettors — T20 odds are priced by thinner models than Test or ODI markets, and the data that drives results (boundary sizes, six rates, powerplay tendencies) is public and underused. This guide covers the markets, the data and the discipline that convert T20's chaos into value.
The Market Hierarchy
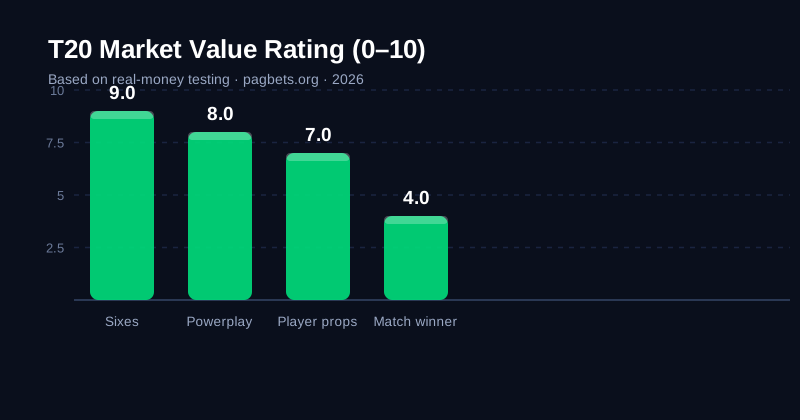
T20 markets rank by efficiency. Match winner is the sharpest — heavily traded, thin margins, hard to beat. Six-hitting markets (total sixes, most sixes, player sixes) are the format's signature and among its softest — they respond to boundary dimensions and batting depth that casual money ignores. Powerplay totals reward understanding of opening lineups and fielding restrictions. Player performance markets reward matchup research. The strategy: use match-winner prices as your benchmark, and hunt value in the markets with public, researchable inputs.
| Market | Efficiency | Key input | Value rating |
|---|---|---|---|
| Match winner | Sharp | Everything | Low |
| Total sixes | Moderate | Boundary size, batting depth | High |
| Powerplay total | Moderate | Opening matchups, restrictions | High |
| Player performance | Thinner | Matchup history, form | Moderate-High |
The Six-Hitting Engine
Sixes decide modern T20 — and they're the most researchable market in the format. The inputs, in order: boundary dimensions (a 65-metre rope produces dramatically more sixes than 75 metres — public data, inconsistently priced), batting depth (six-hitters through the order inflate totals), pitch flatness, and bowling attack quality (pace at the death, death-over specialists). Track each venue's six-per-match average, compare it with the line, and bet the gap. Our IPL guide applies the same framework to the biggest T20 league.

Powerplay Pricing
The first six overs follow predictable patterns: fielding restrictions, aggressive openers, and a defined bowling plan. Powerplay totals reward knowing the openers' strike rates against the specific new-ball bowlers, the pitch's early-over behaviour, and the captain's field-setting tendencies. The market prices the averages; the specialist prices the matchup. Between overs two and six, live powerplay markets offer the format's cleanest research windows.
Live T20: The Overreaction Harvest
Live T20 is where the volatility pays. Prices overreact to wickets and boundaries — a two-wicket over swings the match-winner price further than the match state justifies, and the recovery trade (backing the overpriced side between overs) is T20's classic value pattern. The discipline is unchanged from our live guide: watch the actual match, bet between overs only, cap live bets, and never chase a lost in-play stake. T20 punishes in-play emotion faster than any format.
Bankroll Rules for a Volatile Format
T20's variance demands the strictest version of the standard system: flat stakes at 1–2% of bankroll (never bigger, regardless of confidence), a hard cap of 3–5 T20 bets per day during tournaments, and a separate tournament budget for events like the IPL. The format's losing streaks are real and normal — the bankroll rules exist precisely for this variance. Flat and small beats clever and large every T20 season.