
Why Results Alone Are Not Enough
A team's last five results tell you what happened. They do not reliably tell you what is about to happen, because a run of results contains a large amount of variance — finishing, deflections, red cards and goalkeeping performances all move a scoreline without reflecting a change in underlying quality.
This is the central analytical problem in football betting, and it is why two teams with identical form records are frequently very different propositions. One might have created 14 chances and converted six, the other 5 and converted two. The results match; the underlying strength does not.
Reading a team properly means looking past the scoreline to the chances that produced it. Our lower-league betting guide makes the same point about limited public data, and the value betting guide explains why this is where the edge lives.
Chance Quality Beats Volume
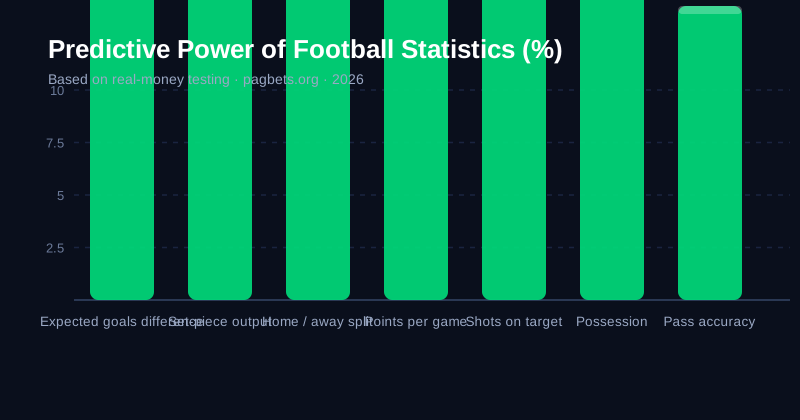
Expected goals is the single most useful football statistic, and it is available for most major competitions. The idea is straightforward: every shot has a probability of being scored based on its position and type, and adding them up estimates how many goals the chances were worth.
Two teams can both create six shots, and one might be worth 1.4 expected goals while the other is worth 0.3. Over a season that difference compounds enormously. It also explains why possession is a poor predictor — a team can hold 60% of the ball in their own half and create nothing from it.
The practical use is to compare a team's expected goals difference against its actual goal difference. A persistent gap in one direction is evidence that results are about to move in the other. It is a genuinely useful signal precisely because the market is slow to price it.
| Statistic | What it measures | Predictive quality | Common mistake |
|---|---|---|---|
| Expected goals (xG) | Chance quality created and conceded | Strong | Ignoring it entirely |
| Shots on target | Attempts on goal | Moderate | Treating as shots |
| xG difference | Net chance quality | Strong | Not comparing to goal difference |
| Possession | Ball control | Weak on its own | Over-weighting it |
| Pass accuracy | Ball retention | Very weak | Using it as a quality proxy |
| Set-piece goals | Dead-ball output | Strong and repeatable | Overlooking it entirely |
| Points per game | Results only | Moderate | Treating as underlying strength |
Set Pieces Are the Cheapest Advantage in Football
Around a quarter of all goals in professional football come from set pieces, and the routines that produce them are highly repeatable. A team with a well-drilled corner routine, a clear attacking-header profile and a delivery specialist will generate chances from the same positions repeatedly.
This is why set-piece output is one of the most under-used predictive signals in the sport. Two teams with identical open-play chance creation can differ by several goals a season purely on set pieces, and the price usually reflects the open-play figure more than the set-piece one.
It also travels with coaches. A manager arriving from a set-piece-strong background tends to improve a team's dead-ball output within a season, which is a genuine, checkable signal. Look at corners won, corners converted, and the quality of the delivery.
- Corners won, a prerequisite for set-piece threat
- Corners converted, the output that actually matters
- Delivery quality, who takes them and from where
- Attacking header profile, who attacks the ball
- Defensive set pieces, less discussed but equally repeatable
- Managerial pedigree, set-piece strength often transfers
Pressing and Defensive Height
Two tactical behaviours reliably predict the kind of chances a team will create and concede: how high they defend, and how hard they press.
A high-pressing team wins the ball closer to the opponent's goal, which produces a higher proportion of high-value chances. It also concedes more, because pressing high leaves space behind. A low block does the opposite, conceding territory and creating almost nothing.
The practical consequence is that a team's tactical profile predicts the type of match it will produce. A high-pressing side facing a team that struggles to play out will generate excellent chances, because the opponent will repeatedly lose the ball in dangerous areas. The market prices both teams' overall quality and frequently underestimates how much the tactical matchup matters.

Form Signals Worth Taking Seriously
Some form indicators are considerably more reliable than the win-loss record. Home and away splits are the most useful, because home advantage is large in football and teams differ substantially between venues. A side averaging 1.80 at home and 2.80 away is being mispriced by anyone using the average.
Strength of schedule is next. Eight wins against bottom-half opposition says much less than three wins against top-half teams. Recent underlying numbers are more meaningful than recent results, and managerial tenure matters because a new manager's initial bounce is a real, documented effect that then fades.
What is not reliable is a simple winning or losing streak. Teams on long winning runs frequently regress, because the results exceeded their underlying performance.
- Home and away splits, the single most useful number
- Strength of schedule, context makes form meaningful
- Underlying chance numbers, better than results
- Managerial tenure, new-manager bounce is real
- Fixture sequence, rotation and congestion matter
- Avoid streak-following, runs of results frequently regress
Why Possession Is the Most Misused Statistic
Possession is the most widely quoted football statistic and among the least predictive, and understanding why is one of the most useful analytical steps available.
Possession counts how often a team has the ball, and says nothing about where on the pitch it has it. A team can hold 65% of possession inside their own third, circulating it harmlessly while conceding chance after chance. The same team with the same possession figure might also hold the ball in the opposition half, creating repeated entries into the box. The statistic is identical; the football is opposite.
This is why expected goals replaced possession as the primary metric in professional analysis, and why teams are now often described by their attacking and defensive profiles rather than by style labels. A possession team is not a category; it is a description that may cover several completely different sides.
The practical betting consequence is that when you see two teams with similar possession figures, the information tells you almost nothing. When you see two teams with similar expected goals figures, they are very likely to be similarly strong.
Using Team Analysis to Build a Price
All of this research exists for one purpose: producing a number you believe to be better than the market's, and then only betting when it is.
Work in that order. Start with the underlying numbers — expected goals created and conceded, split by venue, over a consistent window. Note the set-piece output. Read the team news and identify rotation. Adjust for the tactical matchup, particularly where one team's pressing profile plays directly into the other's weakness building out. Only then form a view, and write down your own price for the market before you look at the offered one.
If the market is offering more than your number, you have a candidate. If it is offering less, you walk away — and walking away should be the most common outcome, because on any given fixture the market is more likely to be right than a research process done in twenty minutes on a Tuesday afternoon.
Record the closing price regardless of what you did. After a hundred bets you will know whether you are consistently beating it, and that single measurement is worth more than any result streak. Our betting journal guide explains how to capture it properly.
Building a Research Routine
The value in reading a team comes from doing the same process every week, not from a clever insight once. A routine that is repeated produces data you can learn from; an occasional deep dive does not.
Before each round, look at expected goals created and conceded over the last five or six matches, split by home and away. Check set-piece output. Read the team news, particularly for rotation. Note the tactical profile. Then form a view and write your own price down before looking at the market.
Keep it in writing. The betting journal method explains how, and it is the only way to know whether your reading is genuinely better than the market's or merely different from it.
- Check xG split home/away over 5–6 matches, not results
- Review set-piece output, it is repeatable and priced cheaply
- Read team news for rotation, congestion and injury
- Note the tactical profile, pressing height and defensive shape
- Write your own price, then check the market
- Keep a written record, review monthly
- Set limits via our responsible betting tools