Why Basketball Punishes and Rewards in Equal Measure
Basketball produces more scoring events per game than any major sport — which makes its markets statistically rich and its live betting uniquely exciting. The same pace punishes the unprepared: 82-game NBA seasons mean volume bettors face variance measured in months, not weekends. The bettors who win are the ones who treat basketball as a statistics problem from day one. This guide shows the structure.
The Two Core Markets: Spread and Total
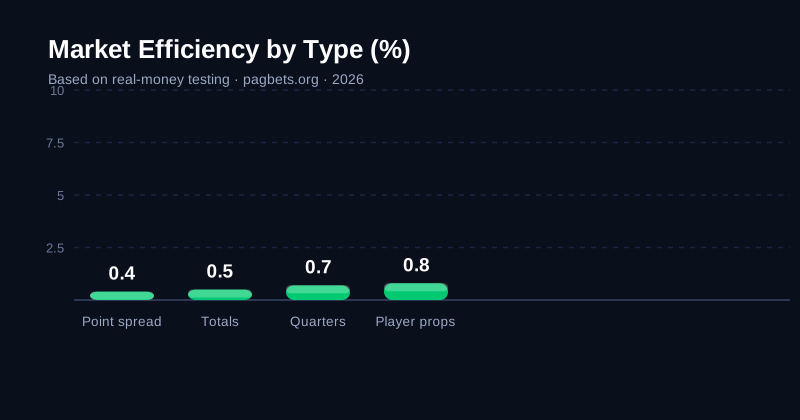
Point spread: the favourite gives points (Lakers -6.5 must win by 7+); the underdog receives them (Celtics +6.5 covers by losing by 6 or fewer). Spreads are the most efficient basketball market, priced within a point of sharp consensus. Totals: over/under the combined score (228.5), driven by two researchable stats — pace (possessions per game) and defensive rating. Totals carry slightly higher margins but respond to research: a fast team against a poor defence pushes totals over; the reverse pushes them under.
| Market | Efficiency | Key research inputs |
|---|---|---|
| Point spread | Very efficient | Injuries, rest days, matchup |
| Total (over/under) | Moderately efficient | Pace, defensive rating, 3-point volume |
| Quarter markets | Less efficient | Rotation patterns, bench strength |
| Player props | Least efficient | Minutes, usage rate, matchup |
The Research Inputs That Actually Move Lines
Four inputs move basketball prices more than anything else. Injuries and rest: NBA teams on back-to-backs with travel underperform the spread by meaningful margins over a season — a public stat the market still underweights. Pace: the single biggest totals factor; track the last ten games, not season averages. Three-point variance: modern offences live and die by the arc, and three-point shooting luck regresses hard — teams shooting unsustainably hot or cold from deep create spread value in both directions. Rotation and schedule: coaches rest starters in blowouts and before playoffs; knowing the rotation intent changes fourth-quarter pricing.
Quarter Markets and Player Props
Where the market thins, value appears. Quarter markets are priced from full-game models, but bench strength and rotation patterns make first and fourth quarters behave very differently — bettors who track rotations find mispriced first-quarter totals regularly. Player props (points, rebounds, assists, threes) are the least efficient tier: minutes projections and usage rate are public, and the market's generic models lag real rotation news. Specialise in one team's props and you'll see the gaps within weeks.
Live Betting: The Timeout Window
Basketball live betting is the best in sport because runs are violent and timeouts create natural pauses. The pattern: a 12–0 run swings the live spread several points; the market reacts instantly; the overreaction appears during the timeout, when the trailing team's price drifts past its true level. Bet the recovery during timeouts — between plays, never during possessions — and cap yourself at two live bets per game. The psychology rules in our mindset guide apply double at basketball's pace.

Season-Long Discipline
An NBA season is 82 games per team and months of variance. The discipline that survives it: flat stakes at 1–2% of bankroll, a defined bet ceiling per week (8–12 is sensible), full logging with closing-line comparison, and zero betting on your own team. The bankroll system is non-negotiable here — basketball's volume makes sloppy staking expensive faster than any other sport.
Getting Started
Open accounts at two bookmakers from our rankings — Bet365 for the sharpest NBA lines, 1xBet for market depth. Pick one team, follow its rotation and pace for two weeks, paper-trade totals and first-quarter markets, then bet small and log everything. Basketball rewards exactly this process — the statistics are public, the season is long, and the market, for all its sharpness, still leaves the door open for specialists.